Are your storefronts lifting your building’s value or holding it back? If you own a small mixed-use corner building in New York City or Westchester County, ground-floor retail is often the swing factor. You want durable income, less vacancy risk, and a smooth sale when the time is right. In this guide, you’ll learn how neighborhood retail trends feed into NOI, cap rates, and buyer demand, plus what to measure and how to position your asset for maximum value. Let’s dive in.
How retail drives value
NOI and lease security
Buyers and appraisers value mixed-use buildings by the income approach: stabilized NOI divided by a market cap rate. The retail and residential components are often underwritten separately, then reconciled into a blended value. Higher, stable ground-floor rents and longer terms tend to reduce perceived risk and support tighter cap rates. You can find the core valuation logic in guidance from the Appraisal Institute.
Lease structure, tenant credit, and renewal options matter. A longer, market-rate lease with strong sales or service demand will typically support a sharper cap rate than a short-term or pop-up use. Frequent turnover or soft gross leases can trigger underwriting haircuts that reduce building value.
Cap rates and market perception
Retail performance affects more than just NOI. If a storefront sits vacant or rents trail the market, buyers often widen the blended cap rate for the entire asset. That raises the return they require and lowers price. Appraisers commonly reconcile component cap rates for retail and residential before landing on a building-level conclusion, which is why a weak retail line item can drag the whole value even when apartments are stable. The Appraisal Institute framework above explains how this reconciliation works in practice.
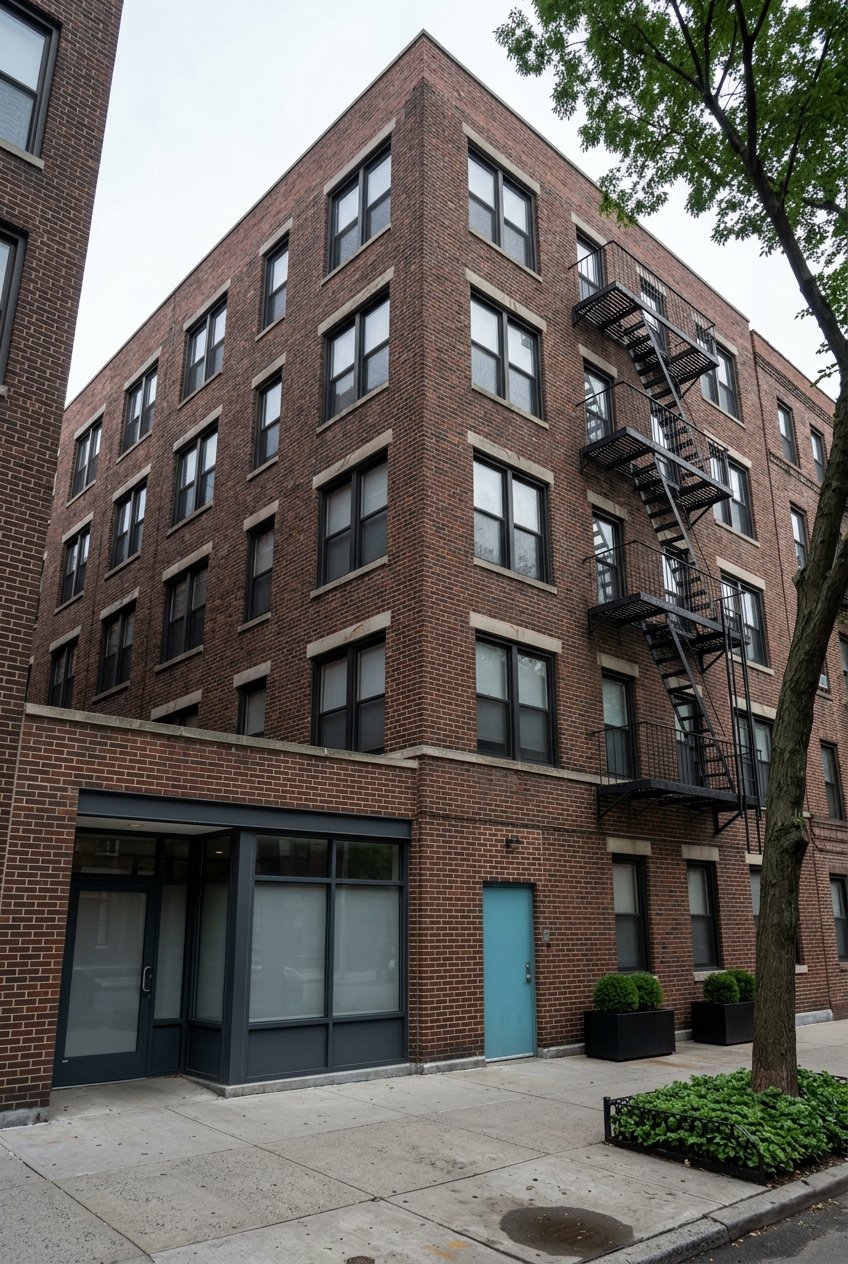
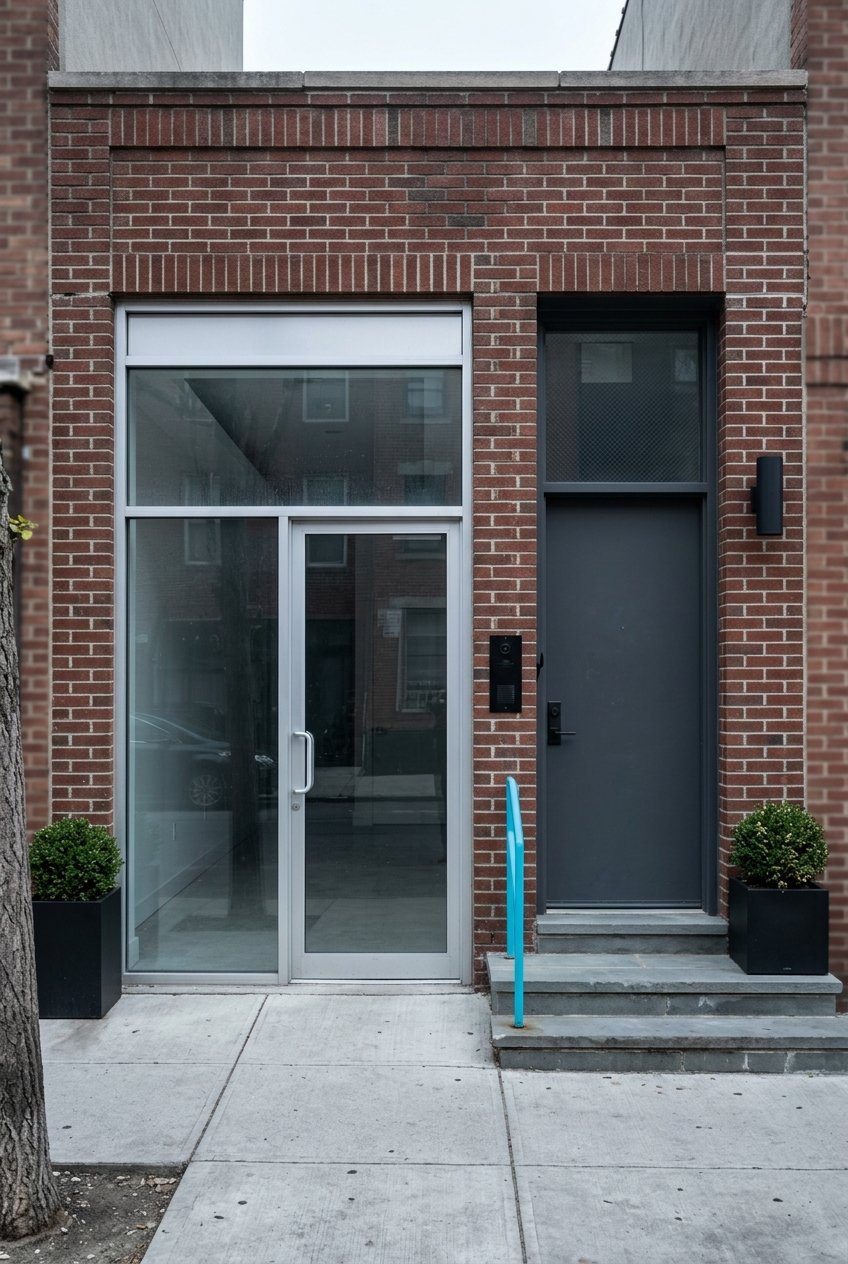
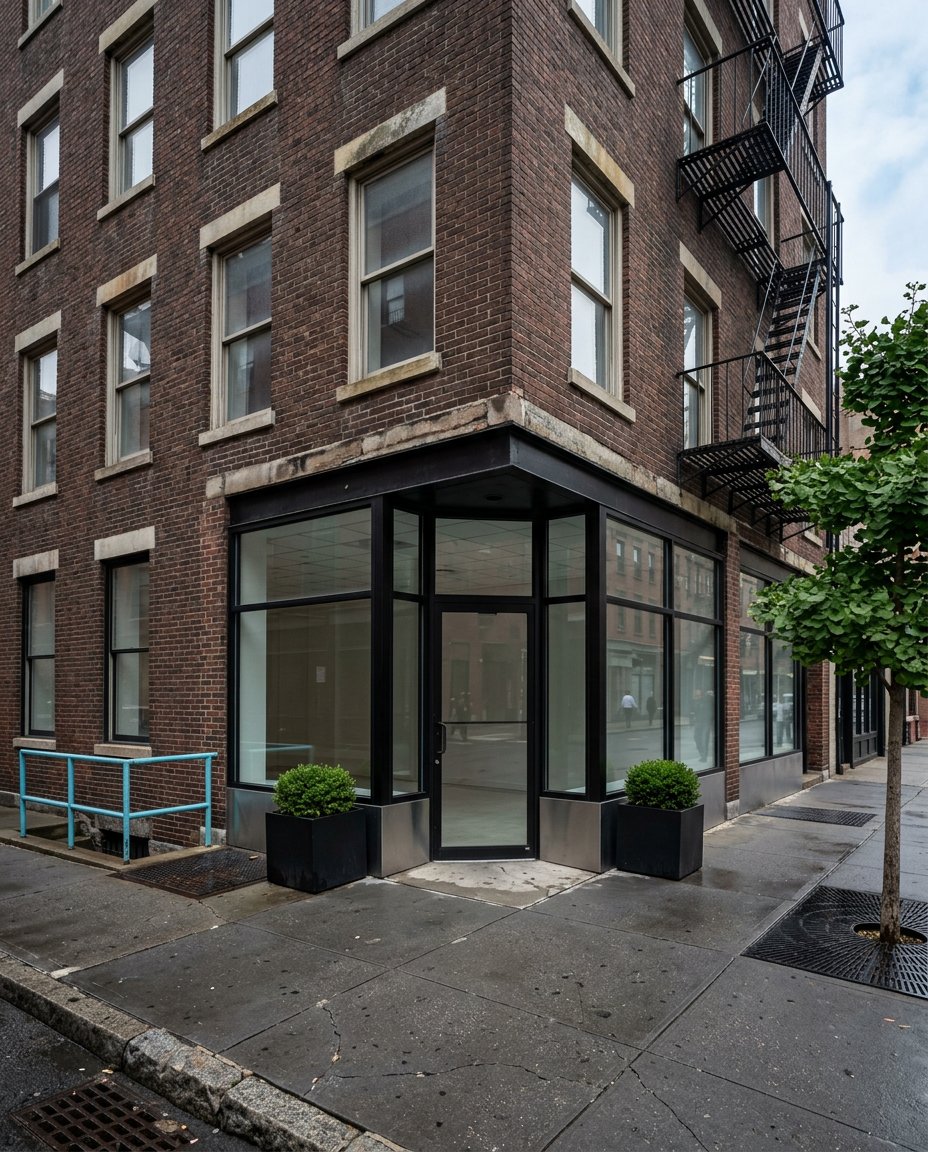
Corner advantages you can quantify
Corner units often command higher effective rents per square foot due to double exposure, better visibility, and stronger pedestrian capture. Industry disclosures and appraisals note higher market rent conclusions for small, high-frontage retail compared with deeper inline spaces. For a technical example of rent differentials tied to frontage and unit size, see this SEC-filed appraisal disclosure.
Neighborhood trends that matter now
Foot traffic recovery and proof
Many NYC corridors have seen foot traffic and leasing recover unevenly. What moves pricing today is proof. Public sources like NYC DOT’s Bi-Annual Pedestrian Counts provide corridor-level context you can include in a sale package or financing memo. Local BIDs also publish recovery snapshots. For instance, Union Square’s commercial report highlights leasing velocity and visitation trends that signal corridor momentum, which buyers view as risk-reducing evidence. Review the Union Square Partnership’s 2025 report for an example of the metrics that resonate.
Tenant mix shifts: necessity and experience
Retail demand has tilted toward necessity services and experiential uses. Food and beverage, fitness, medical, and personal services tend to produce frequent, repeat trips that keep storefronts active. Apparel and discretionary soft goods remain more exposed to online substitution. This shift is widely supported by industry analyses and aligns with what many lenders and buyers prefer to see in underwriting packages.
E-commerce context you should cite
Nationally, e-commerce represents roughly the mid-teens share of total retail sales in recent quarters. Categories vary, but the takeaway is clear: service, convenience, and food concepts remain more store-dependent, which is why they anchor stable NOI in neighborhood assets. When you reference online share, point to the U.S. Census Bureau’s Quarterly Retail E-Commerce Sales for timely, verifiable figures.
Policy and planning signals
Zoning and permitted uses
Zoning sets the ceiling on what your ground-floor space can become. In NYC, commercial overlays like C1 and C2 along residential streets allow local retail below residential floors and define depth, use groups, and FAR that shape rent potential. If your space cannot support higher-demand uses because of use restrictions or depth limits, your achievable NOI narrows. Confirm permitted uses in the NYC Zoning Resolution and overlays through the official NYC Zoning Resolution.
In Westchester, many downtown overlay districts and municipal plans steer where mixed-use intensifies. County planning resources outline how municipalities guide ground-floor activation. For broader planning context, see Westchester County’s Land Use in Westchester.
Public realm, BIDs, and targeted grants
Streetscape improvements, plazas, and BID programming can shift foot traffic and leasing velocity along a corridor. In NYC, corridors that received targeted public-realm investment often recovered faster, which shows up in occupancy and rent trends. In Westchester, the County’s Downtown Improvement Grant program is designed to lift visitation and retail capture in selected downtowns. Review the County’s announcement to understand how these funds can influence demand on specific blocks: Westchester Downtown Improvement Grant program.
Simple valuation check: a quick example
Consider an owner of a small walk-up with $120,000 of residential NOI and $30,000 of retail NOI. Total NOI is $150,000. At a 6.0 percent blended cap rate, indicated value is about $2.5 million. If the retail tenant vacates and buyers widen the blended cap rate to 6.5 percent due to higher perceived risk, value on the remaining $120,000 of NOI would be about $1.85 million. That is a decline of roughly 26 percent, driven by both NOI loss and cap-rate repricing. The numbers are illustrative, but the mechanics mirror how appraisers apply the income approach highlighted by the Appraisal Institute.
What to collect before you sell
Prepare a clean, verifiable package. Buyers and lenders will look for:
- Current retail and residential leases, options, and a rollover schedule.
- Any available tenant sales reports or performance indicators for retail.
- Foot-traffic or visitation evidence for your block or corridor: NYC DOT pedestrian counts or BID reports.
- Proof of retail readiness: hood and venting, grease interceptor, HVAC tonnage, separate utilities, ADA access, loading.
- Zoning confirmation and any pending plan or overlay affecting uses or depth: start with the NYC Zoning Resolution or your municipality’s code in Westchester.
Practical steps to protect value
- Prioritize tenant types that drive frequent trips: food and beverage, medical and personal services, and daily-needs convenience.
- Budget for targeted tenant improvements that expand your feasible tenant pool: kitchen exhaust, grease traps, and mechanical upgrades where appropriate.
- Track lease expirations 12 to 18 months ahead and pre-market with local brokers to avoid downtime.
- Document your retail story: include DOT counts, recent BID metrics, and photos showing corner visibility and frontage. Link to credible public sources like NYC DOT and corridor-level BID reports such as Union Square’s 2025 report.
- Monitor public investments: Westchester’s Downtown Improvement Grant and NYC streetscape projects can change leasing velocity on a short timeline.
When you decide to exit, the way you frame retail risk and upside can move price. A buyer that sees documented foot traffic, a resilient tenant mix, and a space that can support high-demand uses will underwrite tighter vacancy and TI reserves. That usually means a better cap rate and stronger offers. If you want a cycle-aware plan to package your asset and reach qualified buyers across NYC and Westchester, connect with Exodus Capital. We help legacy owners convert long-held equity into liquidity with a disciplined process and boutique speed.
FAQs
How do storefront vacancies affect mixed-use pricing in NYC and Westchester?
- Vacant or underperforming retail can lower NOI and widen the blended cap rate buyers apply, which can reduce value even if apartments are stable, per income-approach principles from the Appraisal Institute.
Which retail tenants are most supportive of value today?
- Necessity and experiential uses such as food and beverage, medical, fitness, and personal services tend to be more resilient than discretionary soft goods, consistent with post-pandemic tenant mix trends and e-commerce exposure patterns in Census e-commerce data.
How can I prove foot traffic to lenders or buyers?
- Pull nearby NYC DOT Bi-Annual Pedestrian Counts and relevant BID reports, then align the data window to your leasing period to show momentum.
What role does zoning play in my ground-floor rent potential?
- Zoning and overlays define permitted uses, depth, and FAR, which cap the range of feasible tenants and achievable rents; start with the official NYC Zoning Resolution or your municipality’s downtown overlay in Westchester.
Do corner units really earn more?
- Corners often capture more visibility and pedestrian flow, which supports higher effective rents; industry disclosures show rent differences tied to frontage and size, as illustrated in this SEC-filed appraisal disclosure.