If you own, are evaluating, or are simply studying a Brooklyn brownstone, one bad benchmark can throw off your entire view of value. A property like 632 President Street in Park Slope looks straightforward at first glance, but the public data tell a more nuanced story. If you want a realistic pricing range, you need more than one headline number. You need a simple way to compare sales, rents, and operating performance side by side. Let’s dive in.
Start With The Property Baseline
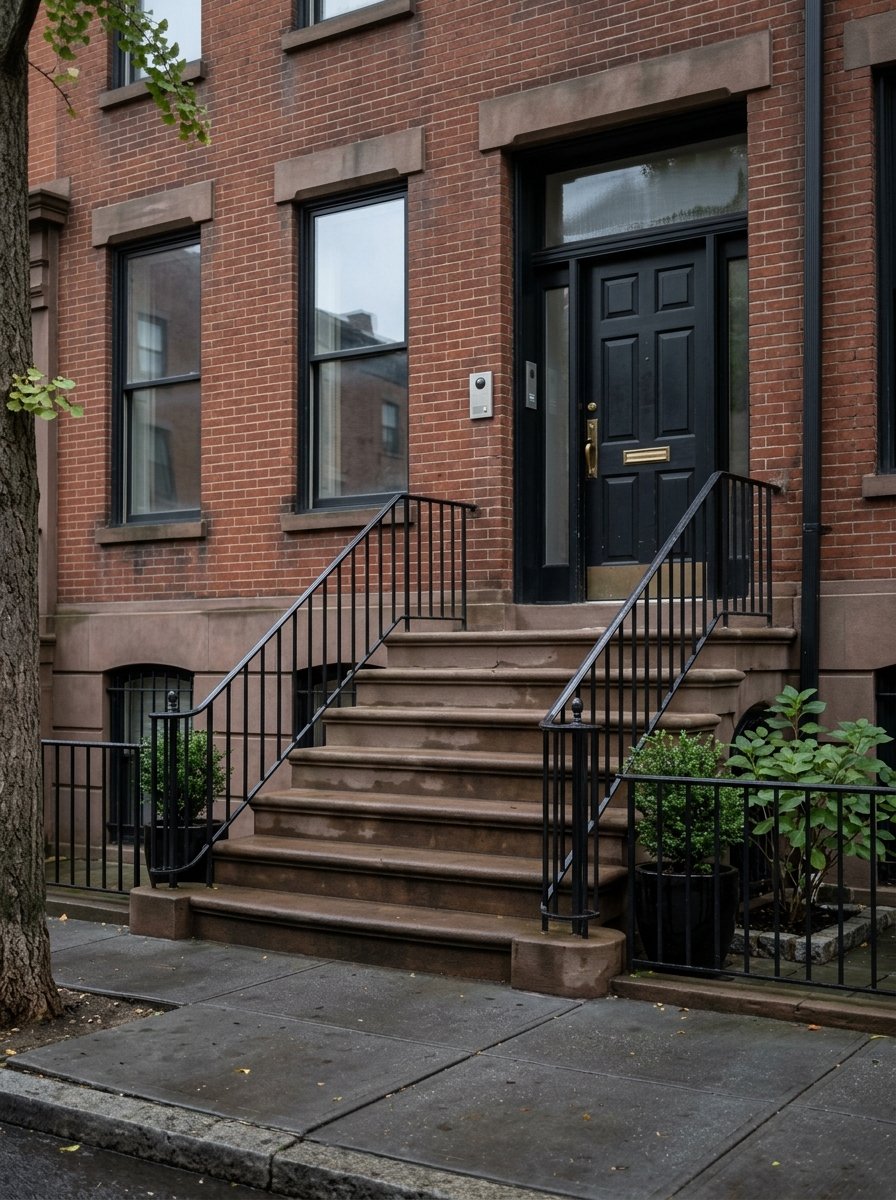
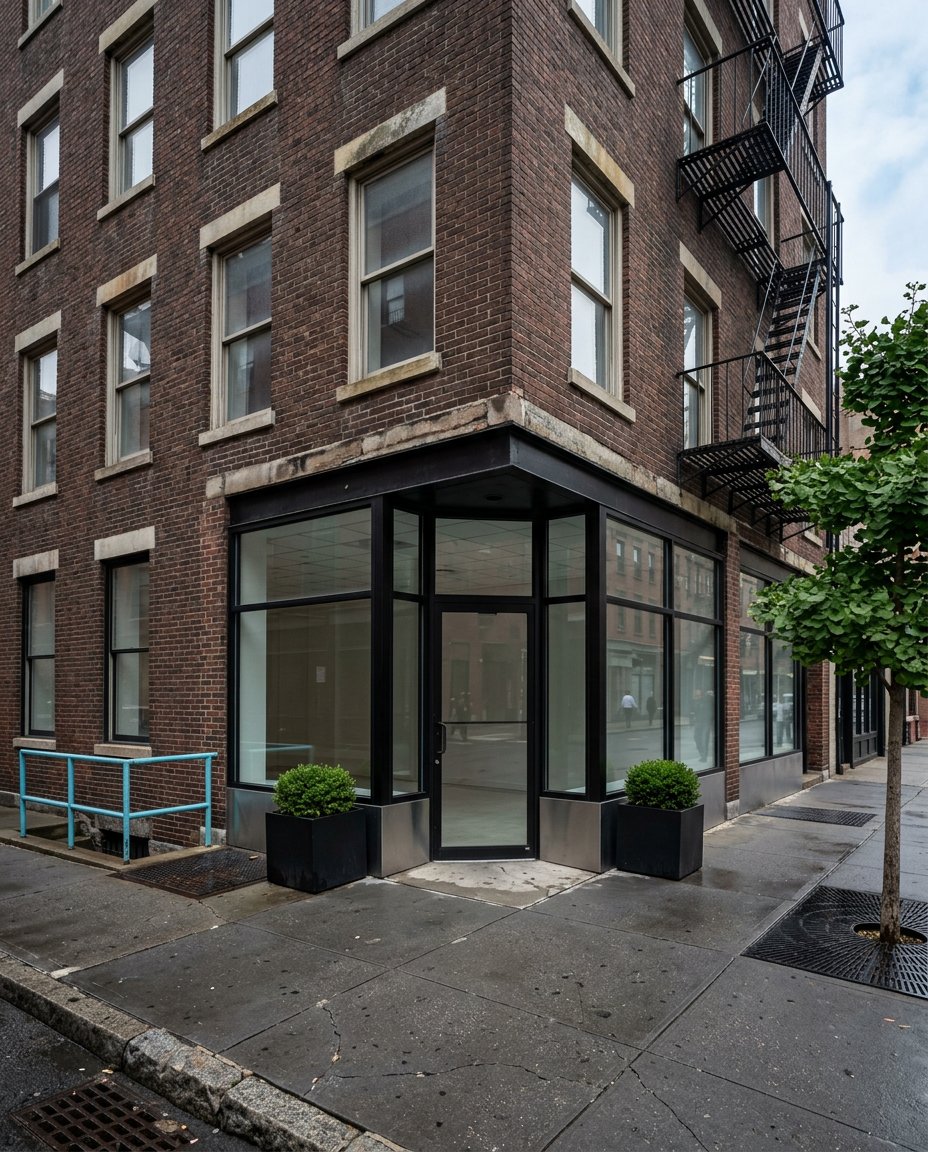
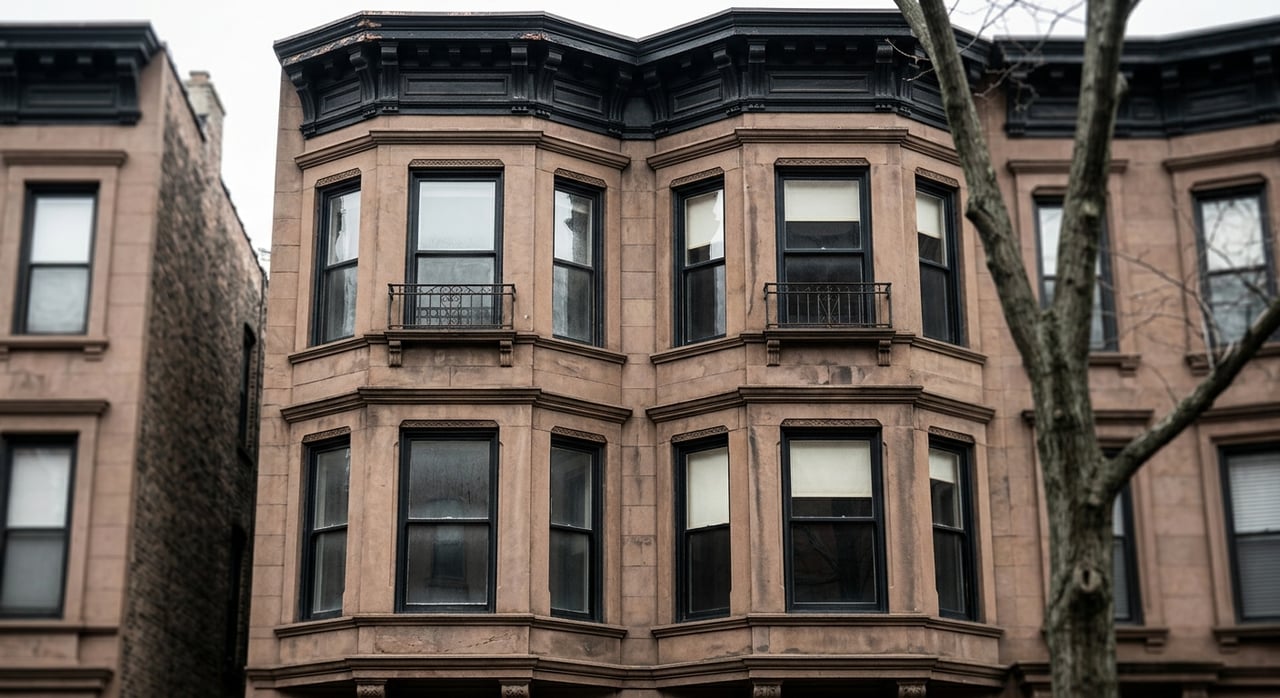
632 President Street is publicly identified as a 1920 four-family house in Park Slope. StreetEasy shows 4 units and 4 stories, while Redfin shows a 17-foot by 82-foot lot. StreetEasy also shows a 3,060 square foot figure in its public history.
One detail matters right away: the 11/05/22 figure of $2.9 million appears in public portal history as an off-market record, but it does not line up cleanly with the sale history shown elsewhere. Redfin shows the last recorded sale as July 1997. That means the $2.9 million figure is best used as an ask-history benchmark, not as a verified closed sale.
That distinction is critical when you benchmark a brownstone. An asking figure can help anchor expectations, but it should not carry the same weight as a deeded transaction.
Build A Three-Layer Benchmark
The most useful way to benchmark a brownstone like 632 President Street is to build a bracket from three layers:
- Sales comps for market pricing
- Rent evidence for income potential
- Expense benchmarks for a basic NOI sanity check
This approach works better than relying on a single price per square foot number. It helps you see whether a value opinion fits the neighborhood, the income profile, and the likely operating costs.
Use Sales Comps Carefully
Public sales near Park Slope show a wide range, even before you adjust for renovation level, vacancy, unit mix, and measurement differences. That is why comp selection matters more than simply averaging numbers.
Here is the public sample from the research report:
| Property | Type | Price | Approx. $/sf | Approx. $/unit |
|---|---|---|---|---|
| 632 President Street | 4-family, 3,060 sf history | $2.9M ask history | $948 | $725K |
| 426 2nd St | Park Slope legal brick 4-family | $4.0M sale | $749 | $1.0M |
| 103 Garfield Pl | North Park Slope multi-family, 2 units | $3.7M sale | $964 | $1.85M |
| 397 2nd St | Park Slope brownstone, 2 apartments | $2.72M sale | $1,511 | $1.36M |
| 296 Park Pl | Prospect Heights 2-family | $2.835M sale | $745 | $1.42M |
| 559 47th St | Sunset Park 2-family | $1.7M sale | $577 | $850K |
Taken together, this sample suggests a broad Brooklyn brownstone range of roughly $577 to $1,511 per square foot. The more relevant Park Slope and near-Park Slope examples cluster closer to the mid-$700s to mid-$900s per square foot.
That makes 632 President Street’s ask-history benchmark of about $948 per square foot notable, but not outlandish for Park Slope. It sits near the North Park Slope comp at about $964 per square foot and above the 426 2nd Street sale at about $749 per square foot.
Compare Price Per Foot And Price Per Unit
Price per square foot is useful because it helps you compare building size against total price. Price per unit is useful because many multi-family buyers think in terms of doors, rent roll, and future income.
The problem is that these two metrics can tell different stories. A four-family building with smaller units may look cheaper on a per-unit basis but more expensive on a per-square-foot basis. A two-family brownstone with premium finishes may command a high price per foot and an even higher price per unit because the buyer pool is different.
For 632 President Street, the ask-history benchmark works out to about $725,000 per unit based on 4 units. In the comp set, that is at the low end of the per-unit range, while its price per foot sits closer to the premium Park Slope cluster.
That is exactly why you should not rely on just one denominator. If you do, you may miss how the market is pricing layout, location, and product type.
Watch The Measurement Basis
Not all square footage figures are created the same way. In the public sample, one property uses Redfin’s usable floor area, while another references county-recorded square footage.
That can create misleading price-per-foot comparisons. A building measured on a broader basis may appear cheaper per square foot than one measured more tightly, even if the market values them similarly.
When you benchmark a brownstone, note what each figure actually represents. If the square-foot basis differs, treat price per foot as directional, not exact.
Use Rent Data As A Separate Check
Sales tell you what buyers paid. Rents help you test whether those prices make sense relative to income.
For Park Slope, the public rent data in the research report show a premium submarket. StreetEasy’s neighborhood page shows a median base rent of $4,100, while Zumper shows an average rent of $4,750 as of June 2026. StreetEasy’s Brooklyn market update puts Brooklyn’s median asking rent at $3,895 in May 2026, which helps show that Park Slope is above the borough median.
StreetEasy also places nearby brownstone neighborhoods on a pricing ladder. Carroll Gardens and Fort Greene are shown at $4,500 median base rent, Prospect Heights at $4,300, and Sunset Park at $2,700. That context helps explain why Park Slope brownstones often trade at a premium relative to other Brooklyn neighborhoods.
Why Rent Estimates Differ By Platform
If two websites show different Park Slope rent numbers, that does not automatically mean one is wrong. It often means they are measuring different things.
In this case, StreetEasy’s Park Slope figure is a median base rent. Zumper’s figure is an advertised average rent. The NYC Rent Guidelines Board study discussed later uses collected rent as part of its operating framework.
Those are all useful benchmarks, but they are not interchangeable. If you mix them together without labeling them, your underwriting can drift quickly.
Use Subject Property Rent History
One of the best public clues for 632 President Street is its own rent history. StreetEasy records a 3-bedroom, 1-bath unit at $3,999 for 1,200 square feet on 10/25/25 and another 3-bedroom at $4,200 on 10/23/25. It also shows earlier 2-bedroom rents between $4,500 and $4,850 in June 2022.
Those figures are helpful because they reflect actual unit-level pricing tied to the building, not just a neighborhood average. They also show why you should be careful with older rent snapshots. In-place or historical rents can lag current advertised levels.
Translate Rent Into A Basic NOI Check
Once you have rent benchmarks, the next step is to test operating performance. For that, the NYC Rent Guidelines Board’s 2026 Income and Expense Study offers a useful public reference point for stabilized buildings.
Using the study’s adjusted method, operating costs were 69.4% of rent collections in 2024 and 61.7% of revenue. The study also reports a median cost-to-income ratio of 68% and a median cost-to-rent ratio of 75%.
The breakdown of expenses is also useful. Taxes were the largest category at 26.3% of costs, followed by maintenance at 17.4%, administration at 12.7%, labor at 11.2%, utilities at 10.2%, insurance at 8.9%, fuel at 7.4%, and miscellaneous at 6.0%.
This does not replace property-specific due diligence. It does give you a reality check when a valuation assumes unusually light expenses.
Run A Simple Cap Rate Sanity Check
The research report includes a simple illustration for a four-unit brownstone modeled as two 2-bedrooms and two 3-bedrooms at current Park Slope averages. That produces gross annual rent of about $279,528.
Applying the RGB’s 69.4% cost-to-rent benchmark leaves about $85,536 of NOI before debt service. Using that NOI, the implied cap rate is about:
- 3.0% at $2.835 million
- 2.3% at $3.7 million
- 2.1% at $4.0 million
This is not an appraisal and not a final underwriting model. It is a fast screen that helps you judge whether a pricing opinion looks generally in line with public data.
Why Similar Brownstones Trade Differently
Two brownstones on paper can look similar and still trade far apart. That is normal in this asset class.
A few common reasons include:
- Unit count differences
- Delivered vacant versus occupied status
- Renovation level and finish quality
- Layout efficiency and unit size
- Measurement differences across portals
- Buyer profile, such as investor versus owner-occupier demand
The comp sample shows this clearly. A vacancy-delivered legal four-family in Park Slope sold around $749 per square foot, while a smaller premium Park Slope brownstone traded around $1,511 per square foot. Both are valid data points, but they reflect different products and buyer behavior.
Spot An Aggressive Value Opinion
If someone gives you a valuation for a brownstone like 632 President Street, test it against all three layers. Ask where it falls versus verified local sales, whether the implied rent assumptions match current public market evidence, and whether the expense load looks realistic.
A value opinion starts to look aggressive when it depends on the highest price-per-foot comp, the strongest advertised rent figures, and a lean expense ratio all at once. A sound benchmark usually sits inside a defensible range, not at the most optimistic edge of every input.
For Park Slope, the public data support the idea that brownstones sit in a premium Brooklyn tier. They do not support treating every townhouse as identical or every portal number as equally reliable.
The Practical Takeaway For 632 President Street
If you want to benchmark a brownstone like 632 President Street, avoid chasing one magic number. Use the property’s public ask history as an anchor, but separate it from verified sales.
Then bracket value with nearby closed transactions, compare both price per foot and price per unit, review subject rent history against current neighborhood rent data, and apply a public expense benchmark to test income-based logic. That process will not give you a formal appraisal, but it will give you a far better sanity check than a single comp pulled out of context.
For owners thinking about timing, pricing, or a potential disposition, that kind of disciplined benchmark can be the difference between a smart strategy and a costly assumption. If you want a discreet, data-driven conversation about how your building may be positioned in today’s market, connect with Exodus Capital.
FAQs
How should you benchmark a brownstone like 632 President Street in Park Slope?
- Start with the property baseline, then build a value range using nearby closed sales, subject and neighborhood rent data, and a realistic expense benchmark for a basic NOI check.
Why is the $2.9 million figure for 632 President Street not treated as a verified sale?
- Public portal histories do not line up, so the 11/05/22 number is best treated as ask history rather than a confirmed closed-sale comp.
What is more useful for a Park Slope brownstone: price per square foot or price per unit?
- Both matter because price per square foot helps compare building size, while price per unit helps test multi-family pricing logic; using both gives a better benchmark than relying on either one alone.
Why do Park Slope rent benchmarks differ across public sources?
- The sources in the research report track different measures, including median base rent, advertised average rent, and collected-rent benchmarks, so the numbers are useful but not directly interchangeable.
What expense ratio is a reasonable public benchmark for a Brooklyn multi-family sanity check?
- The NYC Rent Guidelines Board’s 2026 Income and Expense Study reported operating costs at 69.4% of rent collections in 2024 using its adjusted method, which can serve as a public screening benchmark.
Why can two similar Brooklyn brownstones trade at very different prices?
- Differences in occupancy, renovation level, layout, unit mix, buyer demand, and square-foot measurement basis can all create major pricing gaps, even between properties that seem similar at first glance.