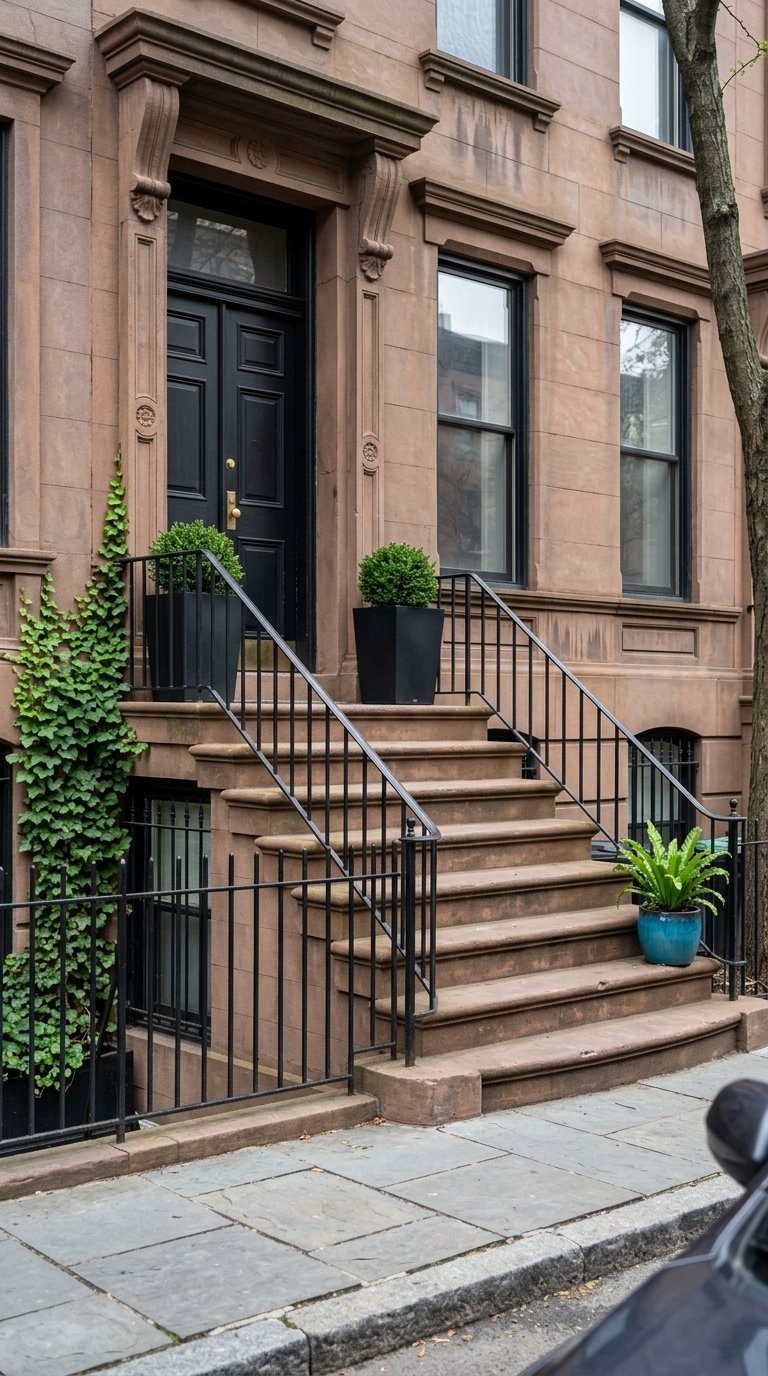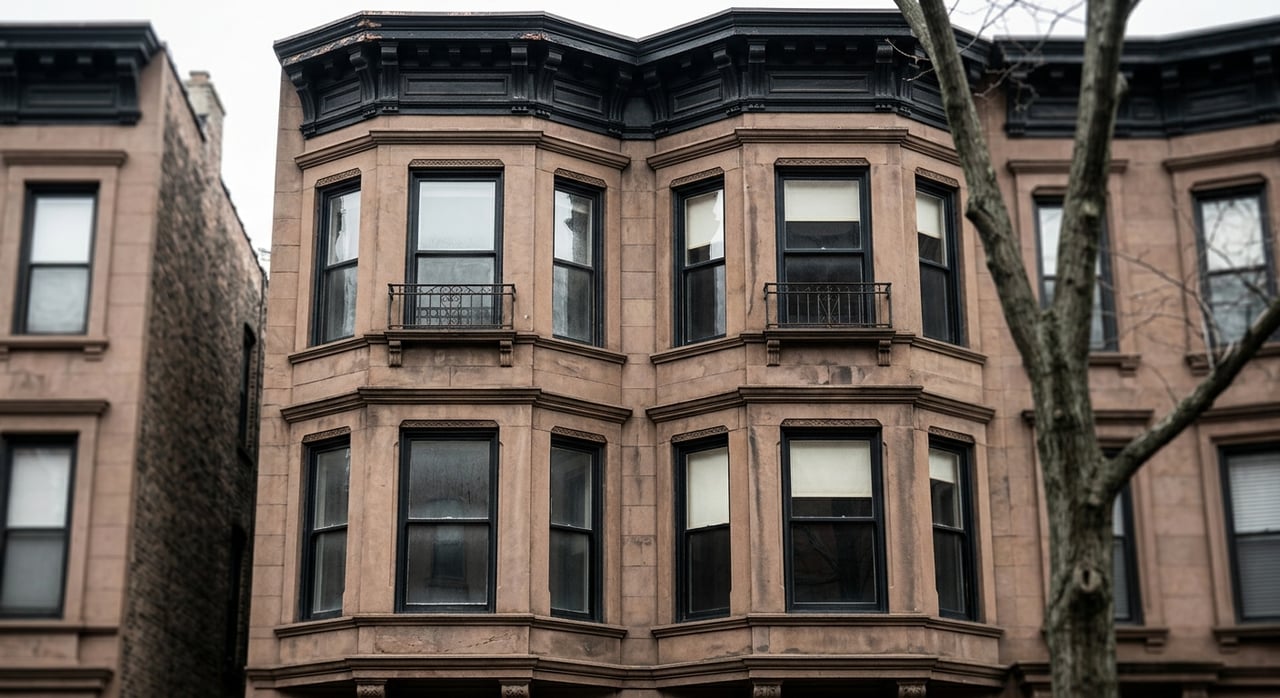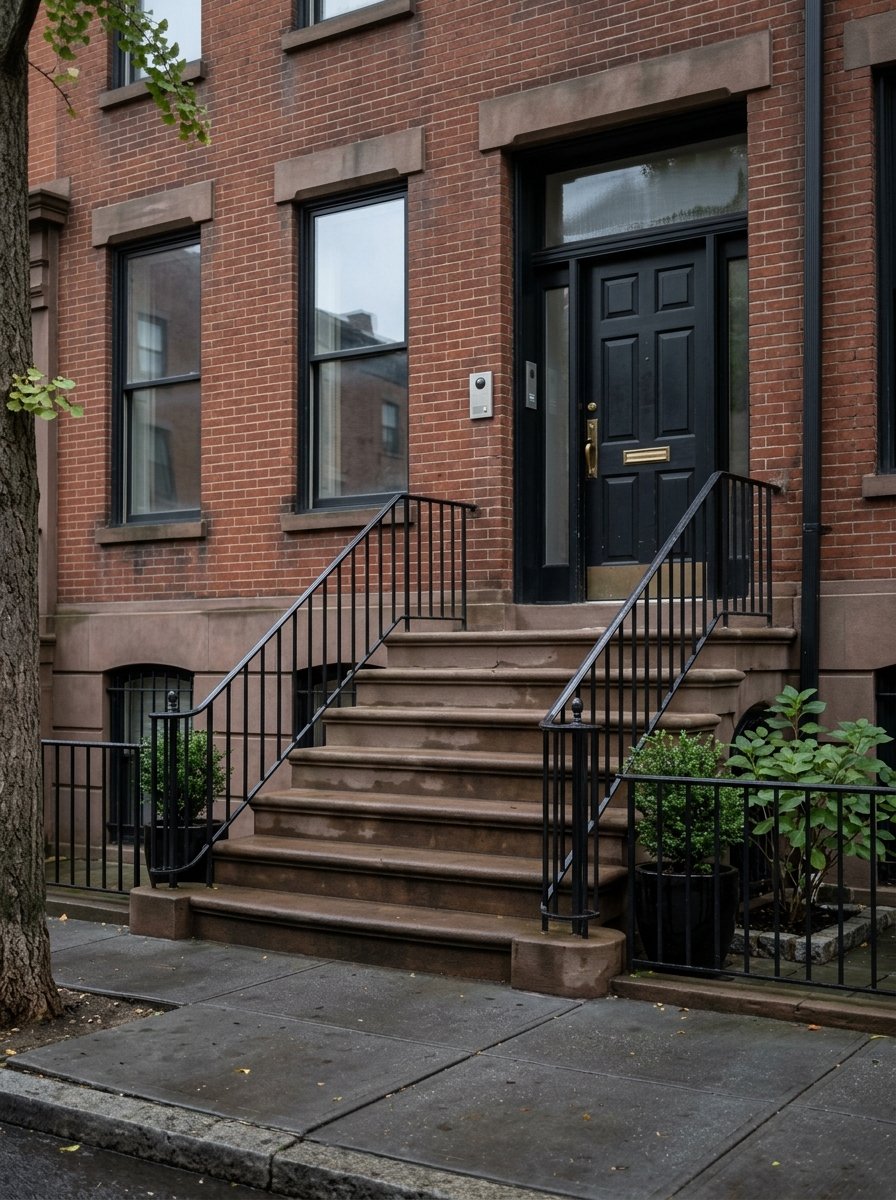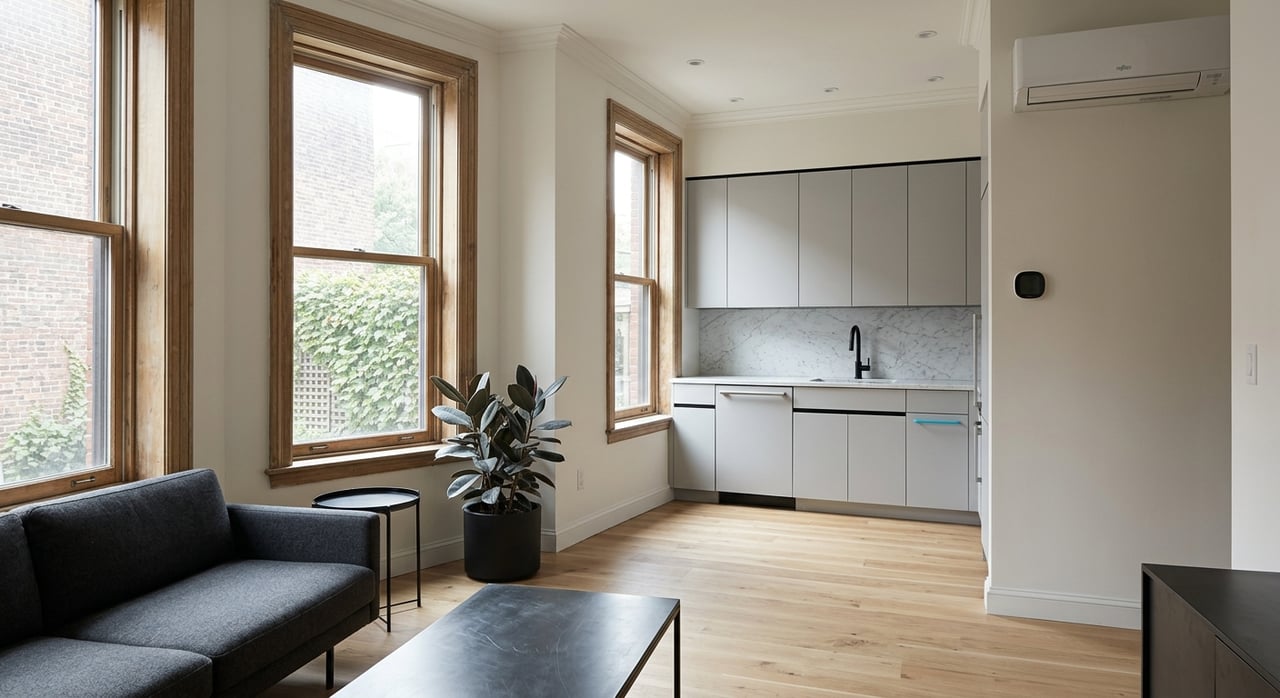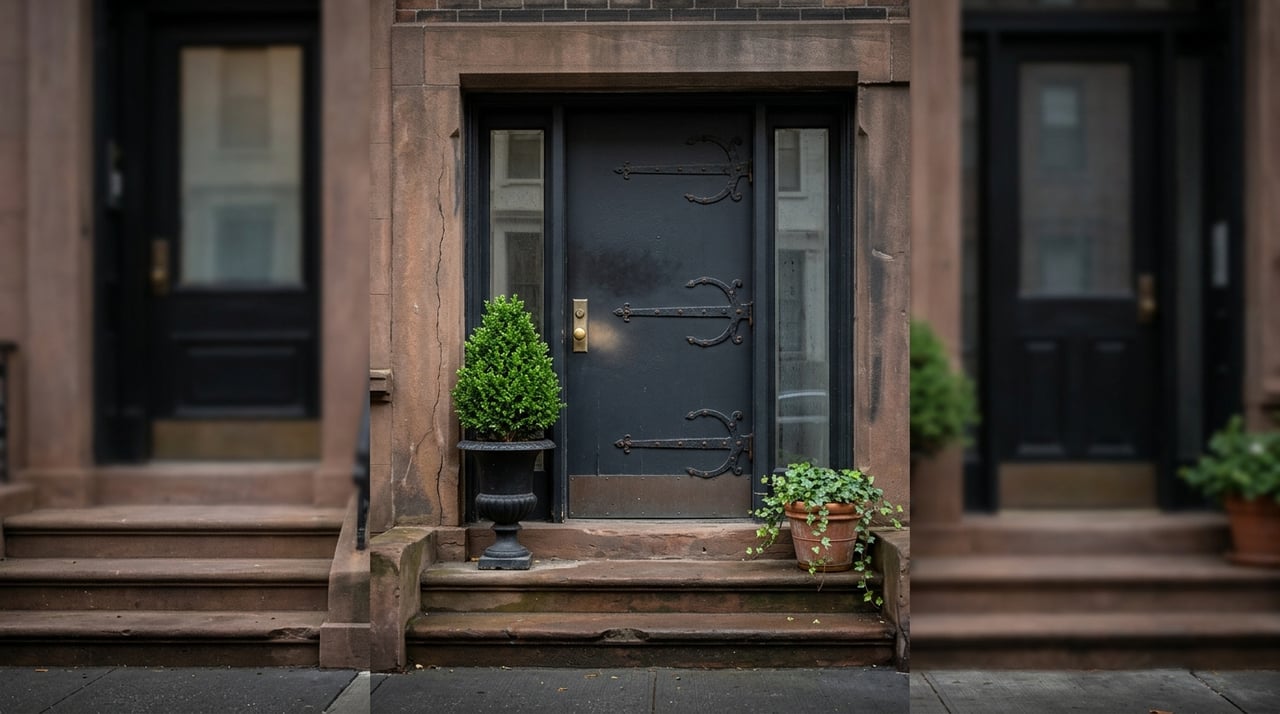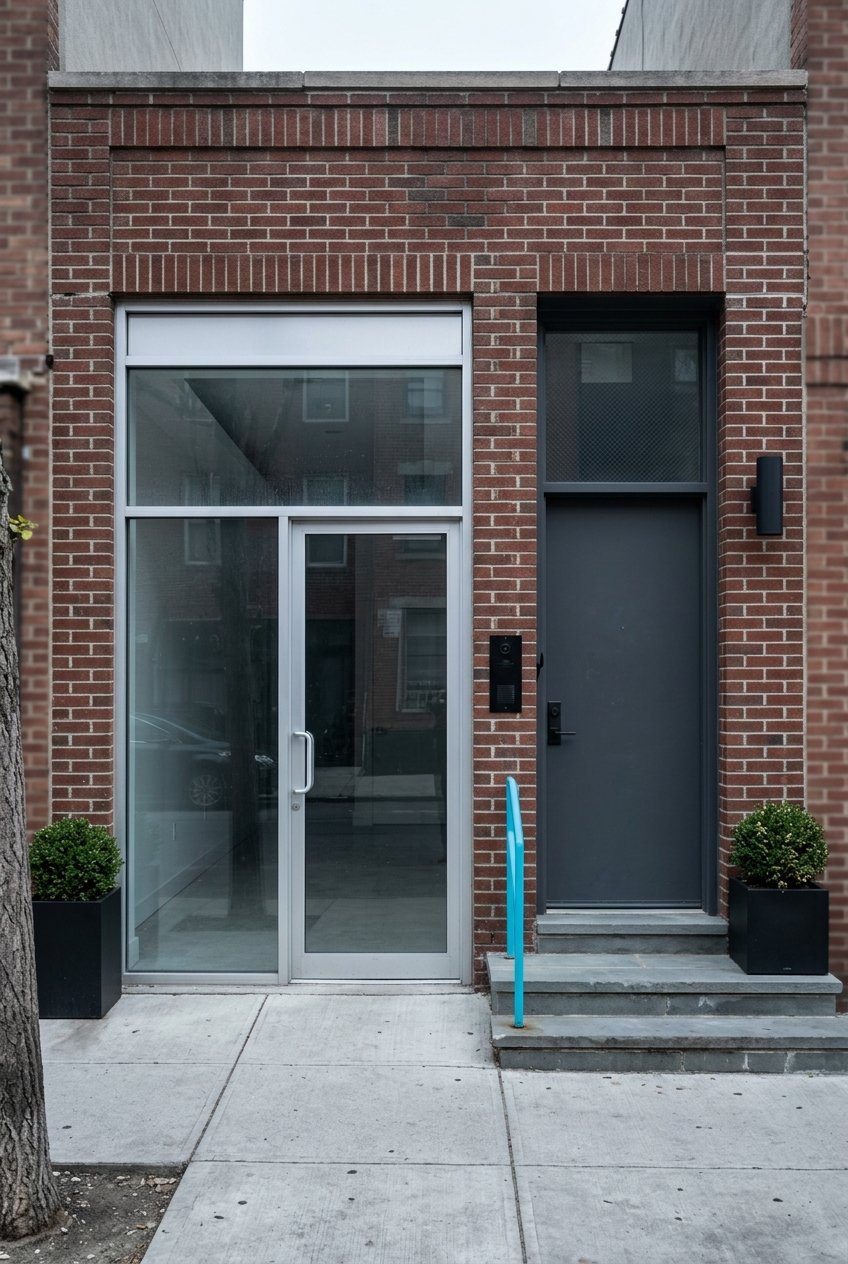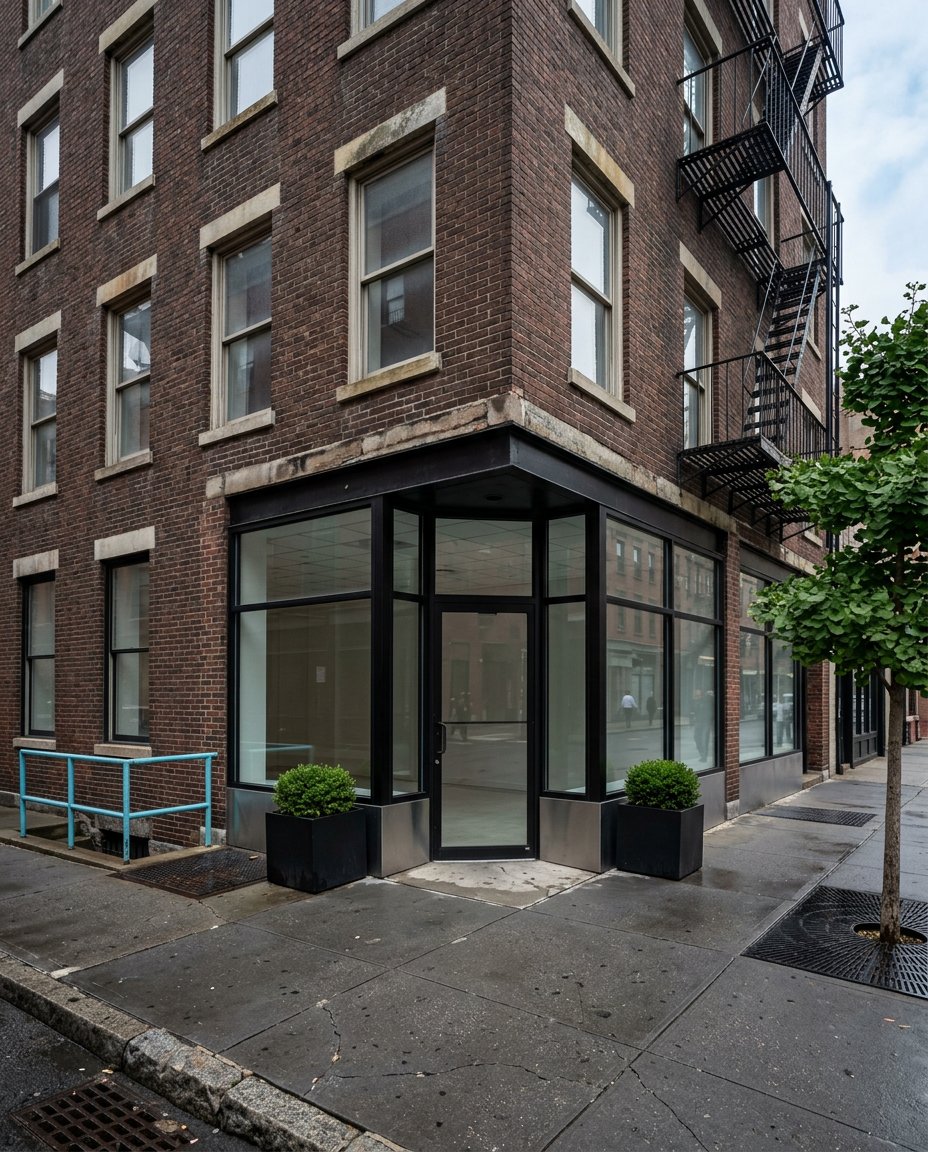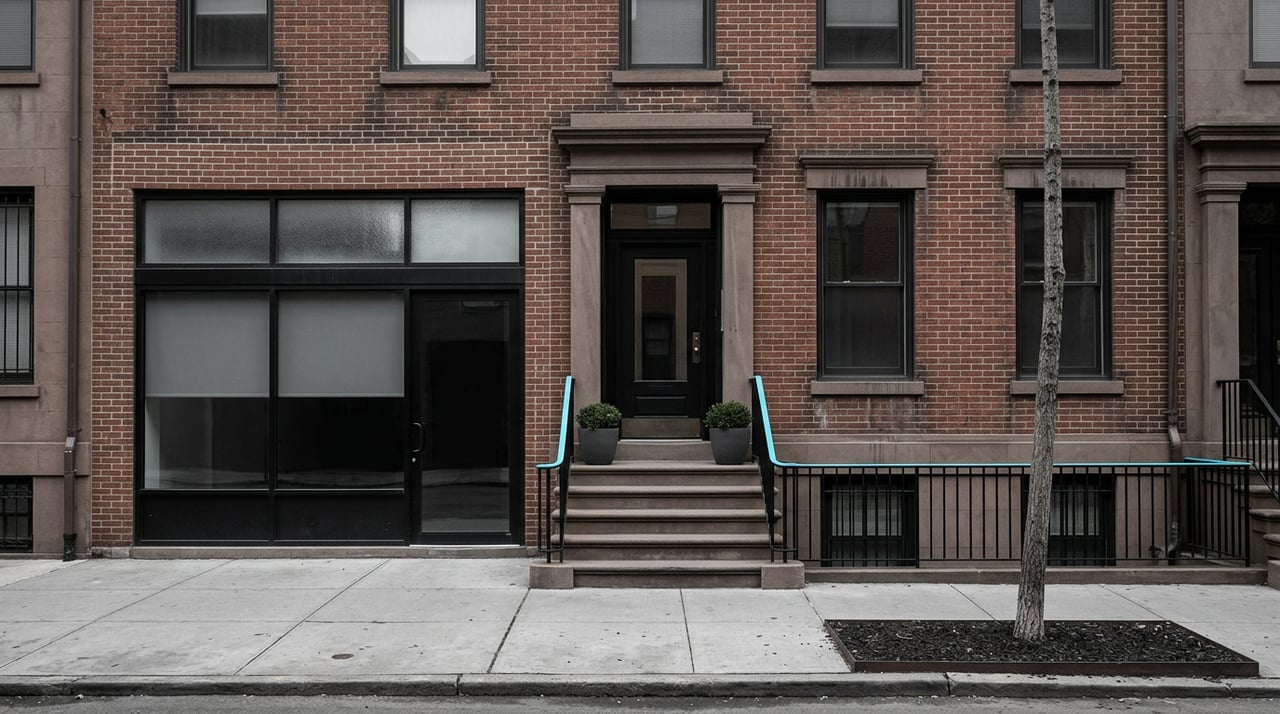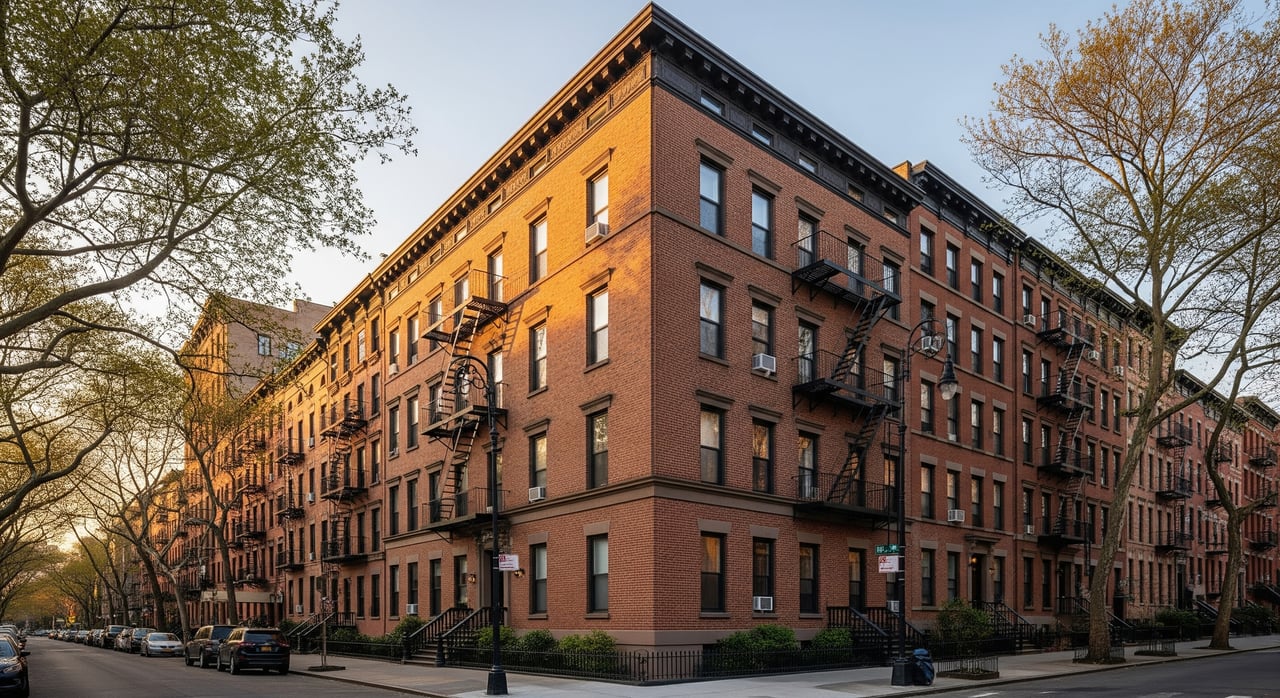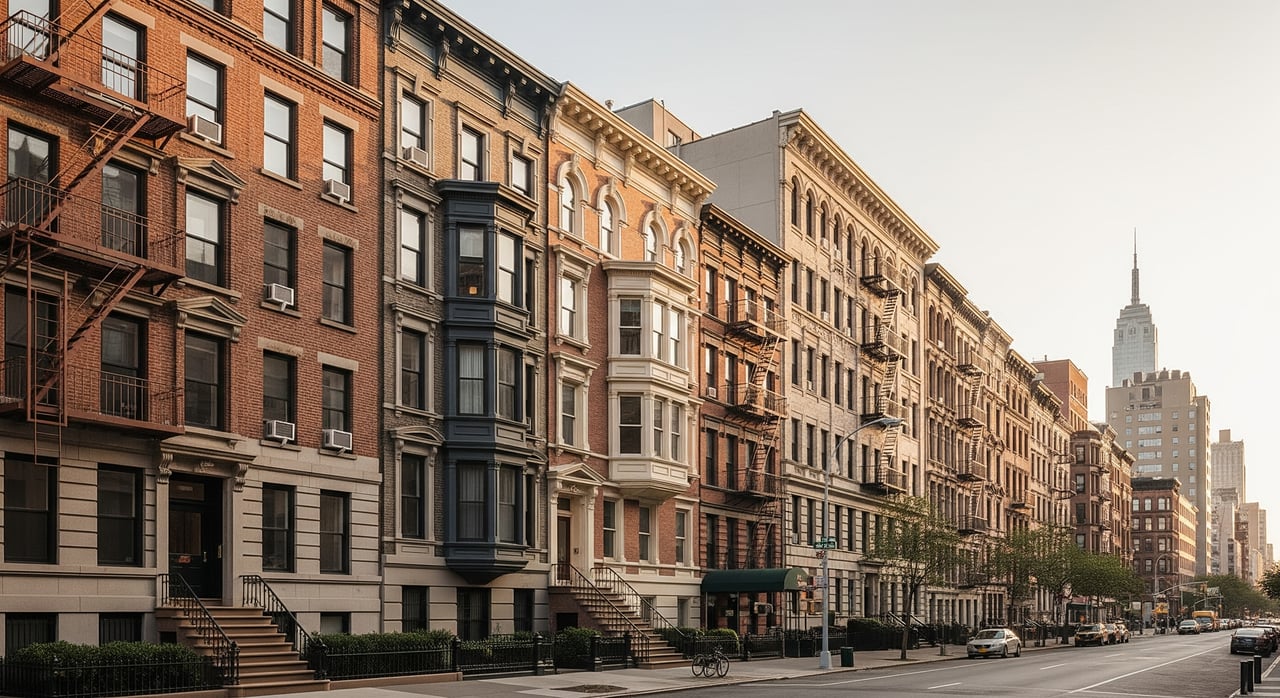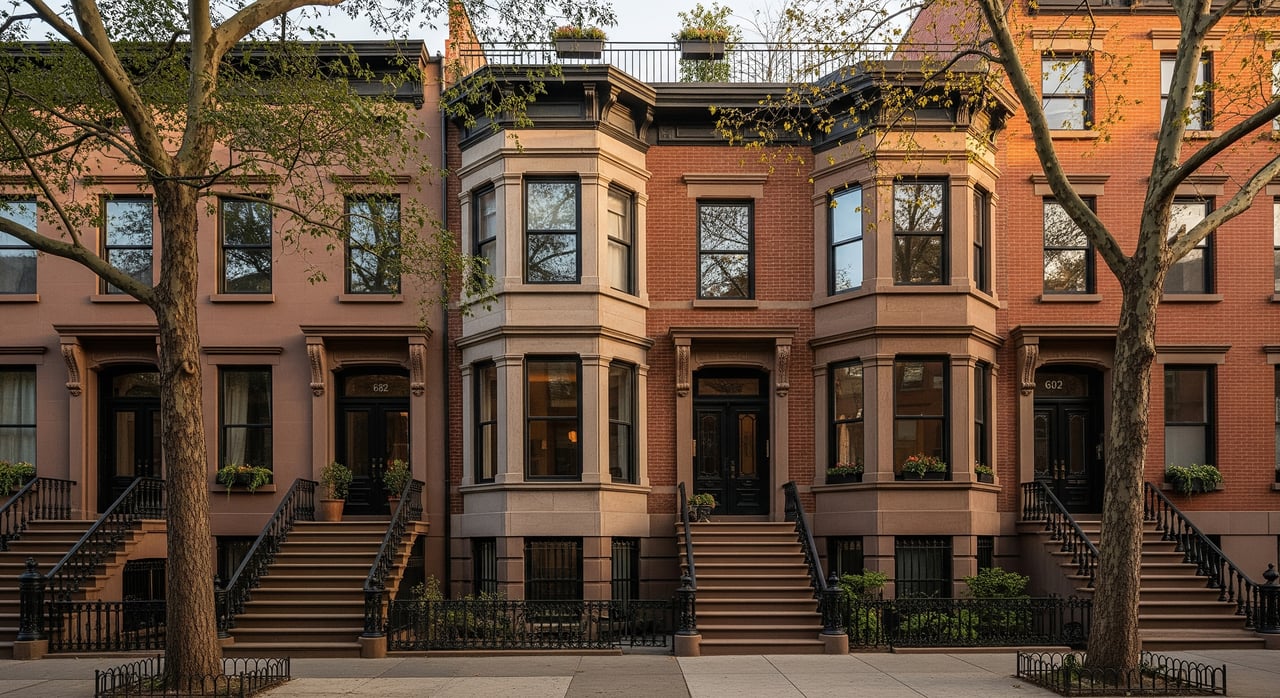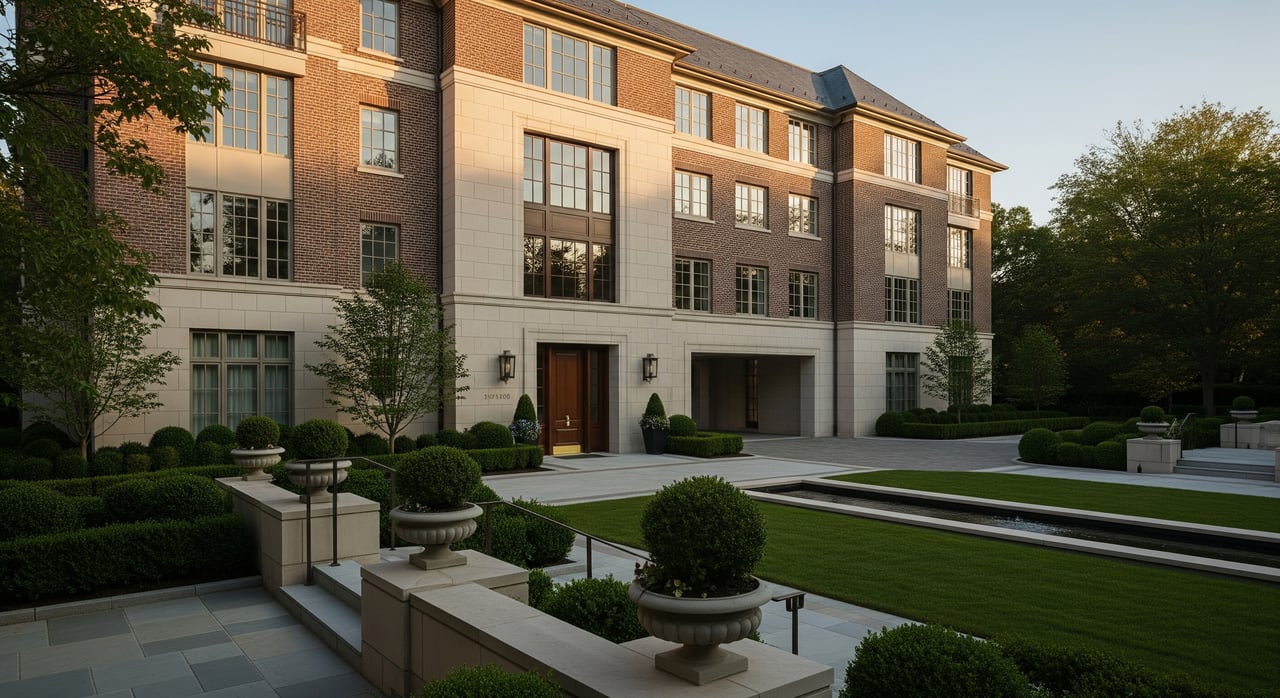
A generational owner walked into our office last month with a 12-building book across the Bronx and Upper Manhattan. Two of the buildings had a mix of free-market and stabilized units. The other ten were pre-1974 and almost entirely regulated. His prior broker had pitched a single blended offering memorandum. Every institutional buyer he had spoken to underwrote the whole book against the worst asset in the pile.
That is the friction the June 2026 rent freeze has hardened into a transaction problem. The buyer universe for New York City multifamily has split cleanly in two, and the way most portfolios are being packaged still assumes one market. Owners who understand where the split runs are getting cleaner clearing prices. Owners who don't are absorbing a discount that belongs to somebody else's asset.
The tape has already priced the split
New York City multifamily sales reached $2.46 billion across 298 transactions in Q2 2026, a 25% year-over-year increase in dollar volume against a 4% decline in transaction count. That headline hides more than it reveals. Free-market assets accounted for 65% of H1 2026 multifamily dollar volume, even though the largest stabilized trade of the half was the $451.3 million Summit Properties acquisition of Pinnacle Group's 5,151-unit portfolio out of Chapter 11, with Flagstar Bank absorbing an estimated $113 million write-down to clear the position.
The per-foot spread tells the story more honestly:
| Segment | Q1 2026 pricing | Direction since 2019 |
|---|---|---|
| Manhattan free-market below 96th St | ~$986/SF | Rents +10% YoY, tightening deliveries |
| Brooklyn free-market | ~$520/SF | Firm, low-supply submarkets leading |
| Queens free-market | ~$321/SF | Steady on core corridors |
| NYC rent-stabilized average | ~$209/SF | Down from $399/SF, a 48% decline |
| Manhattan rent-stabilized | — | Price per foot down 61% |
| Bronx rent-stabilized | — | Price per unit down 44% |
Ariel Property Advisors' 2025 In Review reports the per-foot collapse in the stabilized segment. Vital City, citing Rent Guidelines Board data, records the sale price of buildings with any rent-stabilized units falling from $398,181 in 2019 to $289,478 in 2025, and to just $146,038 for pre-1974 buildings that are at least 50% stabilized. Two segments, two curves, one asset class on paper.
The freeze is the trigger, not the cause
The Rent Guidelines Board voted in late June to freeze rents on one- and two-year leases across roughly one million stabilized apartments, following Mayor Zohran Mamdani's February 2026 reshaping of the board. The freeze grabs the headlines. The underwriting damage was already done.
Ariel's Q1 2026 report shows cumulative operating expenses across the stabilized segment up 40% since 2019 against rent growth of only 16%, a 24-point gap that debt service cannot close. The 2019 Housing Stability and Tenant Protection Act had already removed the mechanisms that used to compress that gap: vacancy decontrol, high-rent deregulation, and full IAI/MCI pass-through recovery. What the freeze did was foreclose the last quiet hope some owners were carrying, that a normalized RGB order plus tenant turnover would eventually restore the growth curve.
The freeze locked in a revenue ceiling. The refinancing wall did the pricing.
Loans written in 2019 through 2021 at 3-to-4% coupons are maturing into an environment where cap rates on stabilized product sit meaningfully above debt cost, cap rates on free-market product sit near 5.4% per Moody's Q1 2026 read, and lenders who used to underwrite stabilized paper have largely retreated. Free-market owners are refinancing at cash-in but survivable terms. Stellar Management placed $117 million from Nuveen/TIAA on its 240-unit Greenpoint book to retire Flagstar debt, and Empire Management pulled $49 million from LMF Commercial against an 11-property Midtown portfolio, both at balances below the 2021 originations. Legacy 90%+ owners cannot run that play. There is no NOI story to underwrite.
What "legacy 90%+" actually means for your buyer list
NYU Furman Center's segmentation, echoed in the Vital City analysis and the Independent Budget Office's May 2026 Demystifying Distress report, identifies roughly 456,000 units in what it calls the "legacy 90%+" stock: buildings that are entirely or almost entirely rent-stabilized, typically constructed before 1974, concentrated in the Bronx, Upper Manhattan, and central Brooklyn. That is close to half of all stabilized apartments in the city. The IBO's read is that distress is not spread evenly across the stabilized universe. It is concentrated in this subset, where roughly 9.2% of buildings with any stabilized unit show negative net operating income per the RGB's 2026 Income and Expense Study, and where the Bronx was the only borough to register an NOI decline last year.
Your buyer list depends on which side of that line each asset sits.
Free-market and mixed buildings are being competed for by yield-oriented private capital and institutional platforms. Carmel Partners paid $241 million for MetLife's 50% interest in five Upper West Side buildings holding 710 units. Go Residential took the 320-unit Ivy Tower in Hell's Kitchen for $148.3 million in June. That pool underwrites off rent growth, a 2026 delivery pipeline of only ~15,000 new units citywide, and the Manhattan free-market rent growth of about 10% year-over-year that Ariel's Shimon Shkury flagged in the Q2 2026 report.
Legacy 90%+ books are being cleared by a different pool. Summit at Pinnacle. Camber Property Group's $79.9 million Brooklyn stabilized sale earlier this year. Benevel Management's $54 million pickup of three Bronx stabilized buildings from Stellar. These are patient-capital plays underwritten to hold. Bob Knakal put the requirement plainly in April: capital, courage, and conviction. The list of names willing to write those checks is short and does not overlap with the free-market buyer pool in any meaningful way.
The bundle-versus-carve decision
Presenting mixed and legacy 90%+ assets as one offering forces the free-market bidder to underwrite the weakest sleeve and forces the distress bidder to price the strongest sleeve as if it were also impaired. Neither pays what the assets are worth individually. The question for any owner with a portfolio spanning both is whether the transaction cost of splitting the offering exceeds the pricing lift of matching each sleeve to its actual buyer.
A few factors tilt that calculation:
- Debt structure. Cross-collateralized loans across mixed and stabilized assets can force a bundled sale unless the lender will consent to a partial release, which is the first phone call, not the last.
- Ownership entity structure. Single-entity ownership across the book raises transfer tax and step-up questions on a carve-out that separate SPEs do not.
- Concentration of the free-market sleeve. If mixed buildings are two or three of a twelve-building book, running two processes is worth it. If they are ten of twelve, a single free-market process with the legacy assets as a separate off-market pitch usually clears higher.
- Timing. The free-market sleeve trades on a 60-to-90-day marketing cycle. The legacy sleeve trades on relationship velocity and can run in parallel without contaminating the primary process.
The owner who walked in last month left with a two-track plan. His two mixed buildings will be marketed to the free-market pool at Brooklyn per-foot comps. His ten Bronx legacy buildings will be shown, discreetly, to the four groups in the city currently writing checks in that segment. The blended IM went in the trash.
Three questions to answer before you list
Is the freeze permanent for underwriting purposes? For your buyer's model, yes. Mayor Mamdani campaigned on freezing rents for the full four-year term. Even buyers who expect a policy shift by 2030 will underwrite four years of zero regulated rent growth against continued expense inflation. Your OM should assume the same.
Does the IBO's finding that most stabilized buildings are not in poor condition help my valuation? For buildings outside the legacy 90%+ segment, it removes a discount that some buyers apply reflexively. For legacy 90%+ buildings in the Bronx and Upper Manhattan, the RGB's own violation and NOI data still support the buyer's distress underwriting. Cite the IBO where it helps. Do not cite it where it does not.
Should I refinance instead? If your existing debt matures inside 18 months and your building is majority free-market or mixed with a reasonable market-rate share, a cash-in refi is often the better move, and recent Stellar and Empire trades show lenders are still writing that paper. If your building is legacy 90%+ and your debt matures inside 18 months, the honest answer is that a sale, even at today's marks, likely returns more equity than a forced restructuring, because the traditional lender pool has left the room.
The market did not price the rent freeze in June. It priced it years ago, in every stabilized loan that funded on assumptions the 2019 law had already invalidated. What changed in June is that the last narrative supporting a wait-and-see position was removed. Owners choosing to transact now are doing so into a bifurcated market that rewards precision in packaging and punishes the reflex to bundle.
If you are weighing an exit on a mixed or stabilized portfolio and want a candid read on how the two buyer pools would price your specific book, Exodus Capital runs that analysis before we take an assignment. Discuss your exit strategy with our team, or review our approach to large NYC portfolios in this cycle and valuing rent-stabilized buildings.